
These days, a store can rank #1 on Google, have a solid conversion rate – and not appear at all in ChatGPT. Not a poor ranking. Non-existent. If you don’t track this, you won’t notice it until competitors are already being recommended in AI responses and your own numbers remain unremarkably stable. These new AI KPIs are designed to highlight exactly this gap – before it becomes a revenue problem.
Anyone who wants to understand today whether their online store is being found in AI searches like ChatGPT, Perplexity, or Google AI Overviews, whether AI-powered recommendations truly lead to more revenue, and whether AI tools are being used by the team needs metrics other than bounce rate and ROAS.
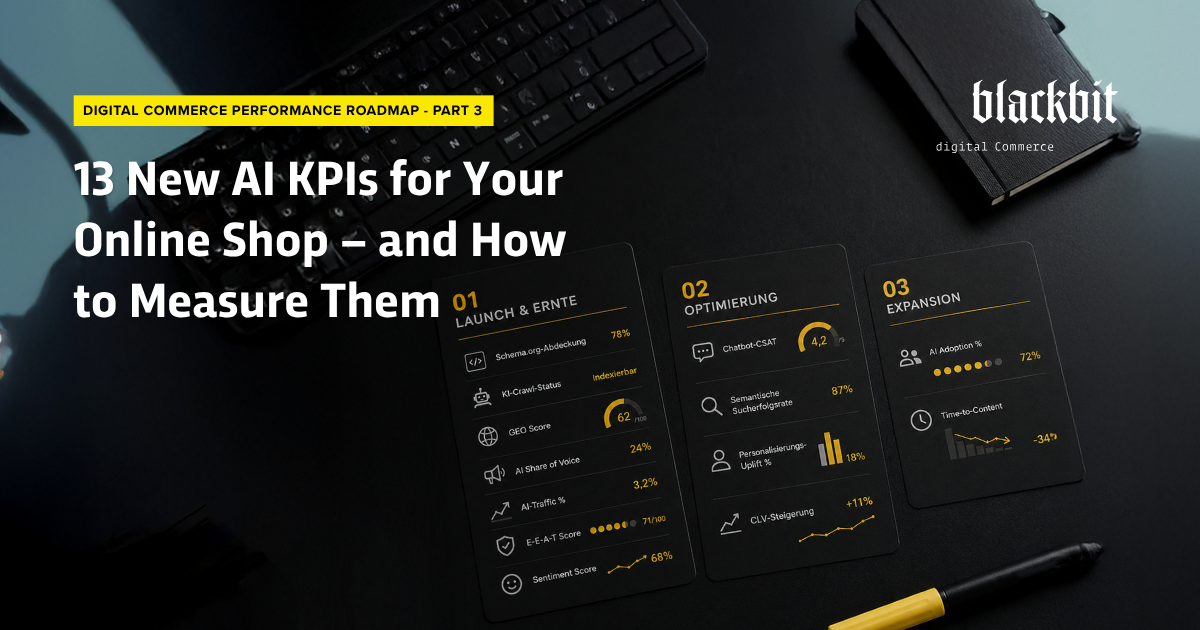
Blackbit’s Digital Commerce Performance Roadmap (DCPR) supplements the traditional set of KPIs with 13 AI-specific metrics, organized according to the three DCPR themes: Launch & Harvest, Optimization, and Expansion. This article explains all 13 – what is being measured, how it’s measured, and what realistic target values mean.
The Cost of Waiting
The likelihood that ChatGPT, Perplexity, or Google AI Overviews will even mention your store already depends on decisions you aren’t measuring. Schema.org markup, robots.txt settings, author signals – if you’re not familiar with these “hygiene” KPIs, you won’t know whether your store is even visible to AI systems, let alone recommended by them.
This isn’t just a future issue. Purchasing decisions are already shifting toward AI-generated responses – competitors who close this gap sooner will build a lead that can’t be caught up with overnight: Visibility in generative responses is self-reinforcing; the more often a provider is cited, the more likely they are to be cited again. Anyone who doesn’t measure a baseline today won’t be able to compare themselves to anyone in six months – they simply won’t know where they stand.
Traditional KPIs vs. AI KPIs: What’s Changing
Traditional performance metrics measure behavior on a provider’s own platform. What happens before that – whether a store is recommended in an AI response before anyone even searches – remains invisible. AI KPIs close exactly this gap: They measure visibility in generative search systems, the impact of AI features in the store, and AI usage within the team.
Topic 01: Launch & Harvest – 7 KPIs for Visibility and Trust
The launch and harvest phases are all about being found in the first place and being deemed trustworthy – by search engines as well as by AI systems.
Schema.org Coverage
Measures the percentage of pages with correct structured markup. This is a prerequisite for AI systems to be able to classify a page correctly at all. Tools: Screaming Frog, Google Search Console.
AI Crawl Status
Checks whether GPTBot and PerplexityBot are allowed to index the pages. Blocking GPTBot in robots.txt significantly reduces the likelihood of being cited as a source in ChatGPT responses – regardless of content quality or GEO score. Tools: Screaming Frog, Google Search Console.
GEO Score
A composite index used by Blackbit that measures how visible a brand appears in generative AI responses from ChatGPT, Perplexity, Google AI Overviews, and Copilot. Calculated via Conductor Intelligence (alternatives: Rankscale, Profound, Otterly.ai) using a fixed set of benchmark prompts. Target: +20% above baseline in 6 months.
AI Share of Voice
A brand’s own mentions relative to competitor mentions in AI responses, measured using the same set of benchmark prompts as the GEO Score. Target: > 25% SoV in the DACH benchmark. Tool: Conductor.
AI Traffic %
Percentage of all website visits that can be verified as originating from AI responses – identifiable via referrers such as chatgpt.com or perplexity.ai. Relevant for attribution: Without a baseline, it will not be possible to verify later whether GEO measures were effective. Tool: Google Analytics 4.
E-E-A-T Score
An audit-based composite of measurable trust factors: author profiles with Schema.org markup, About page, backlink quality, reviews, HTTPS, legal notice. Relevant because AI systems have been shown to cite sources with structured author signals more frequently. Target score: > 75/100. Tool: Conductor.
Sentiment Score
The tone of user feedback and external mentions from reviews, social media, and forums. Values vary by tool – it makes sense to consistently use one tool and monitor trends rather than comparing absolute values. Target: > 70% positive mentions. Tool: Conductor, Brand24, Mention.
Topic 02: Optimization – 4 KPIs for Conversion and User Experience
Once visibility is established, the optimization phase determines whether that attention translates into revenue.
Customer Satisfaction Score for AI-Powered Chatbots in the Online Store (Chatbot CSAT)
Measured via a post-conversation survey immediately after the interaction. The target value of > 4.0/5.0 serves as a guideline – it makes more sense to compare later values against your own baseline established before the first chatbot update rather than relying on an absolute comparison. Tools: Intercom, HubSpot Service Hub.
Semantic Search Success Rate
Percentage of all search queries in the store that result in a click on a result – no zero results, no immediate abandonment. Target value: > 70%. Tools: DooFinder, Algolia
Personalization Uplift %
Conversion effect of AI recommendations compared to the non-personalized standard view, measured via A/B testing. Guideline: > 15% uplift; in practice, Nosto customers report 10–30% depending on category and traffic. Tool: Nosto.
CLV Increase
Measures whether personalization measurably increases customer lifetime value. A target of +10% in 6 months is ambitious – it makes more sense to first establish a baseline and then monitor progress quarterly. Tool: HubSpot CRM.
Topic 03: Expansion – 2 KPIs for Team and Efficiency
Expansion can only succeed if the team and processes grow alongside the AI strategy.
AI Adoption Rate
Percentage of team members who have actively used AI tools within a defined time period – measured via login data and usage events, not by the number of licenses. Target: > 70% active usage after 3 months. Tools: Microsoft 365 Admin Center, Notion Analytics.
Time-to-Content
Average time from content briefing to approval. Measures whether AI writing assistance accelerates content production. Target: > 30% reduction compared to documented baseline. Tools: Pimcore Editorial Workflow, Jira.
Which Three AI KPIs Should You Implement First?
Not all 13 KPIs can be implemented at the same time. To get started:
- First check the GEO Score and AI crawl status – to determine whether the store is even accessible and visible to AI systems. This takes one day.
- Schema.org coverage as a technical prerequisite for all AI visibility KPIs – can be implemented quickly.
- Personalization Uplift % – directly contributes to revenue and provides the business case for further AI investments.
What Are AI KPIs in E-Commerce – And Which Ones Can Be Measured Today?
AI KPIs in e-commerce are metrics that measure how visible an online store is in generative AI systems, how effectively AI features work within the store, and how extensively the team uses AI tools in their daily work. Blackbit’s DCPR categorizes 13 such KPIs across three themes: Launch & Harvest (Schema.org coverage, AI crawl status, GEO Score, AI Share of Voice, AI traffic %, E-E-A-T Score, Sentiment Score), Optimization (Chatbot CSAT, Semantic Search Success Rate, Personalization Uplift %, CLV Increase), and Expansion (AI Adoption Rate, Time-to-Content). They are measured using tools such as Conductor, GA4, Nosto, and HubSpot – on a monthly basis in line with the DCPR quarterly cycle. Blackbit uses these KPIs for mid-sized e-commerce companies in the DACH region to make AI investments manageable and measurable.
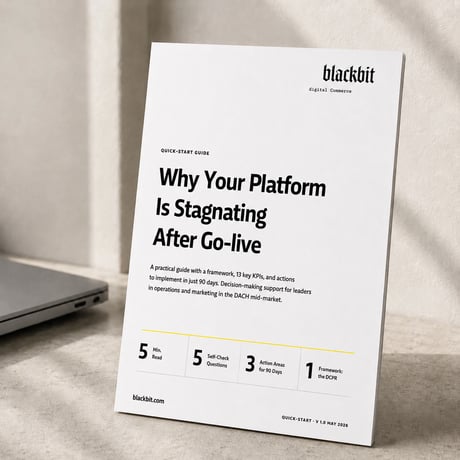
Your Next Step: The DCPR Quick-Start Checklist
The DCPR Quick-Start Guide shows which of the 13 AI KPIs you should start with – complete with specific measurement methods, target values and tool recommendations for medium-sized e-commerce businesses.
7 pages. 5 minutes' reading time.
Further reading:
→ What is DCPR? The Growth Framework for E-Commerce Explained
→ GEO Score: How visible is your store in ChatGPT and Perplexity?
